iFANN
    Rechercher sur iFANN...
    Connexion
    Accueil
    Actualités
    Vidéos
    Photos
    GIF
    Explorer
    Sondages
    Récompenses
    iFAMOUS
    Wiki
    Animé
    Salons
    Notifications
    Messages
    Favoris
    Profil
    WikiRécompensesiFAMOUSClassementsSecteursRécompenses créateursRécompenses utilisateursConditionsConfidentialitéRègles de la communautéRetrait / DMCAAideDéveloppeurs

    © 2026 iFANN

    Accueil
    Rechercher
    Messages
    Alertes
    Profil
    Photo
    Nate
    Nate@nate_5122w
    💭Tech💭AI🎮Visual Studio Code
    @Jolliai IDE dashboard

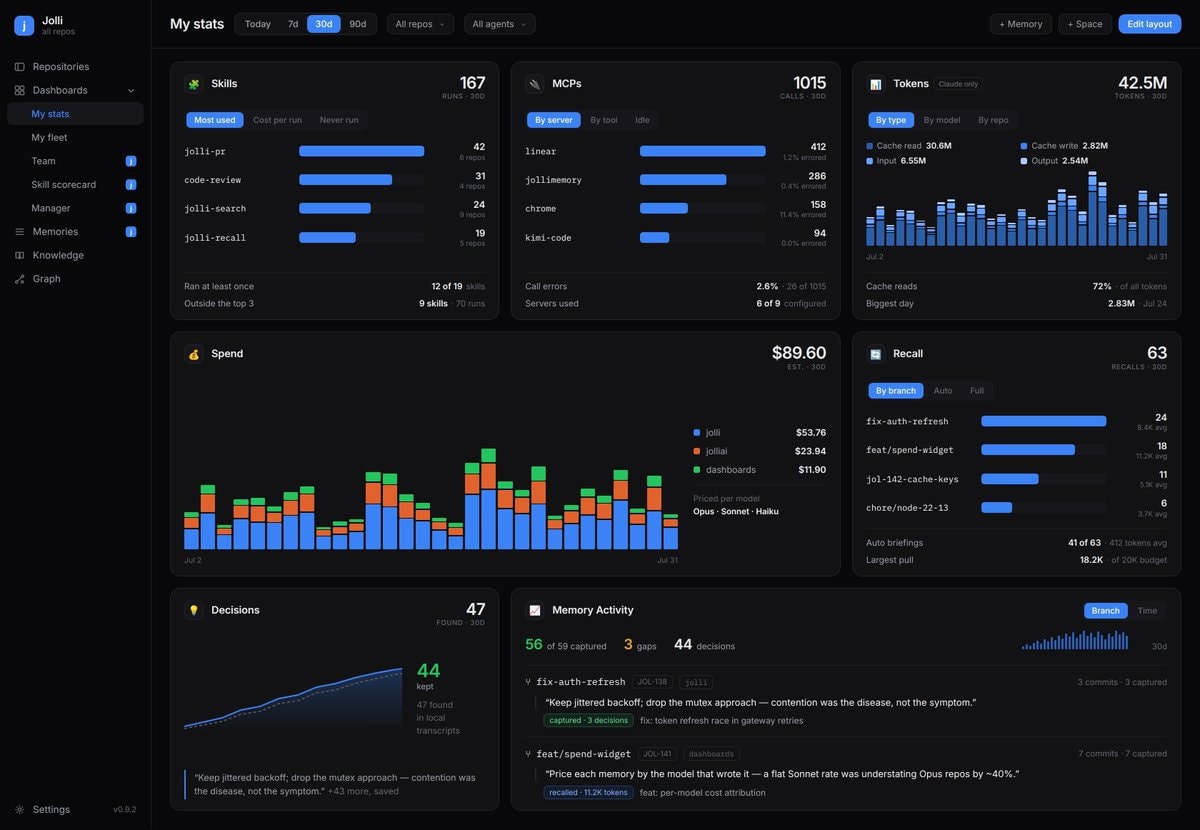
    @nate_512just dropped a privacy-first dashboard built specifically for agent workflows, and it plugs straight into your IDE instead of forcing context switches. Tracking AI spend usually means leaving your editor to check provider consoles, but Jolli reads local session history to generate analytics right where you code. The tool displays usage data in the native environment so you can access it via VS Code command palette or call it directly from Claude Code or Cursor without breaking flow. It automatically scans local session history and stores everything in a local SQLite database so your data stays on your machine unless syncing is explicitly enabled. I rarely get excited about analytics tools, but this actually keeps users focused by eliminating the need to jump between windows.

    Voir la publication d'origine
    @Jolliai IDE dashboard

    Photo de @nate_512· Sep 5, 2026· Tech

    À propos de cette photo

    The image is a screenshot of a dark-themed dashboard interface. The focus is on various statistics and metrics related to a system or application, presented in a clean, data-driven style. The dashboard displays sections for "Skills," "MCPs," "Tokens," "Spend," "Recall," and "Decisions," each with charts, graphs, and numerical data. Notable elements include bar charts showing usage and cost, stacked bar charts illustrating spending over time, and lists of recent activities or decisions. The overall mood is professional and analytical, typical of a software or project management tool. The top left corner shows the logo "Jolli" with "all repos" underneath.

    Voir toutes les photos de Tech

    ?

    Plus de photos de Tech

    Voir toutes les photos de Tech
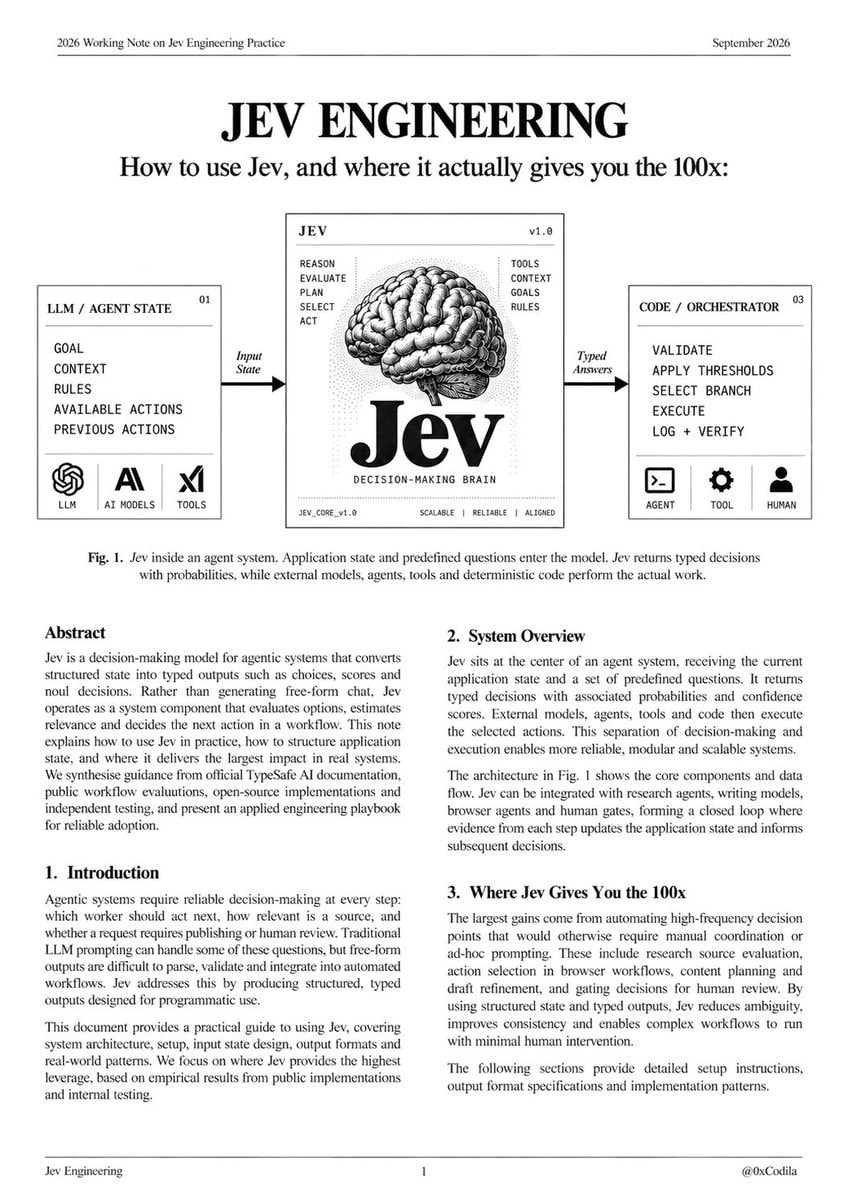
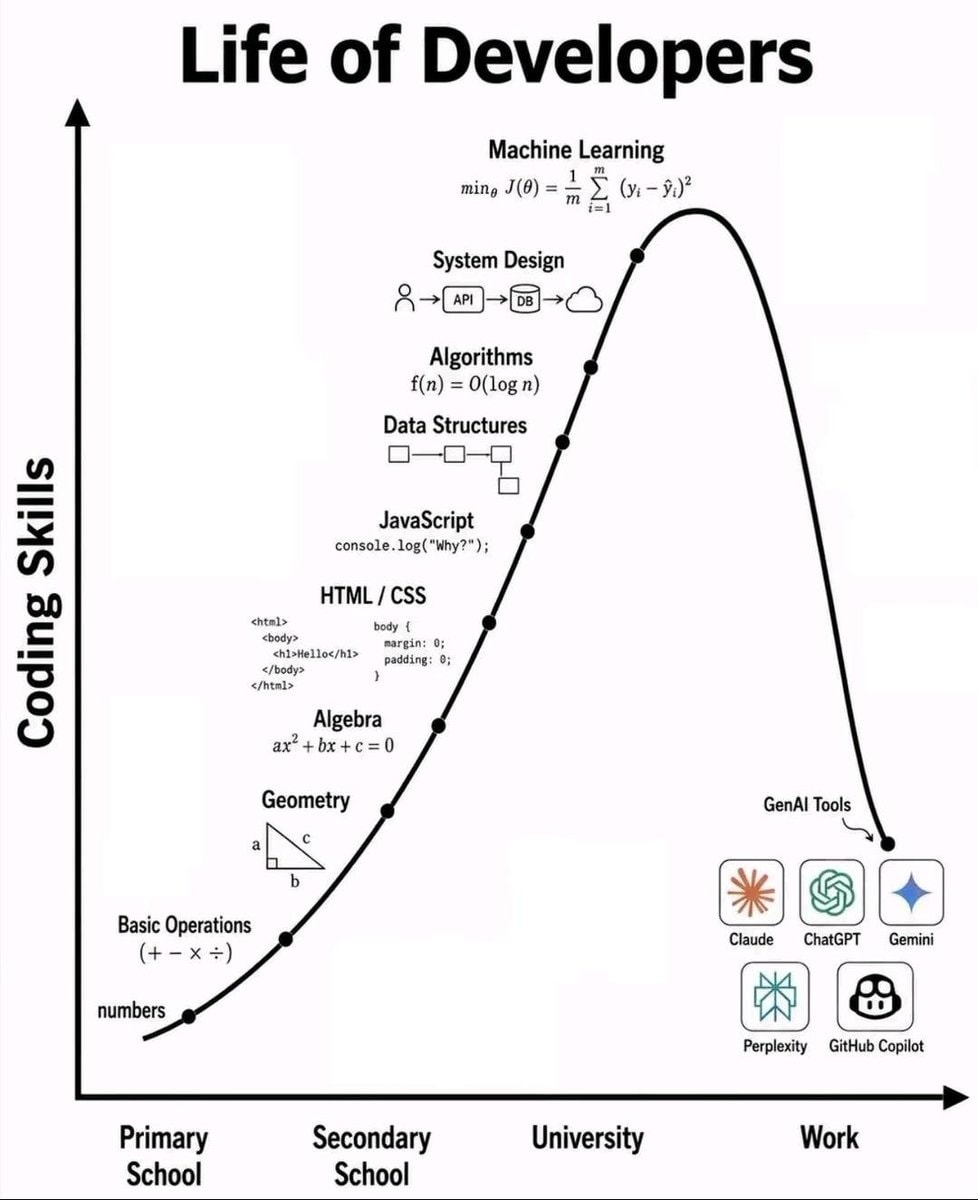
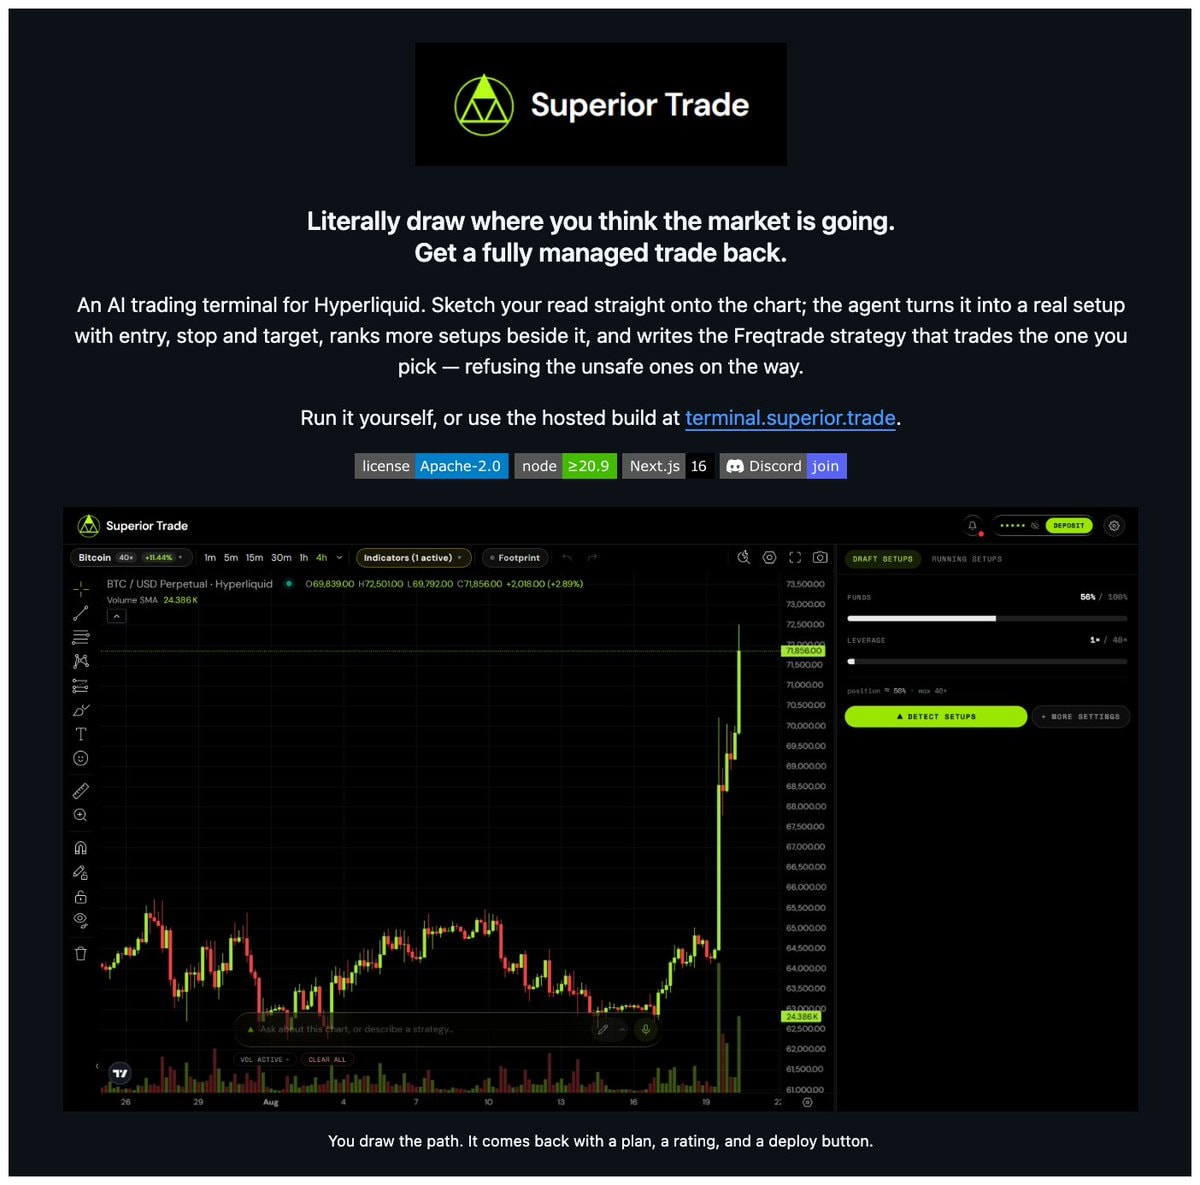
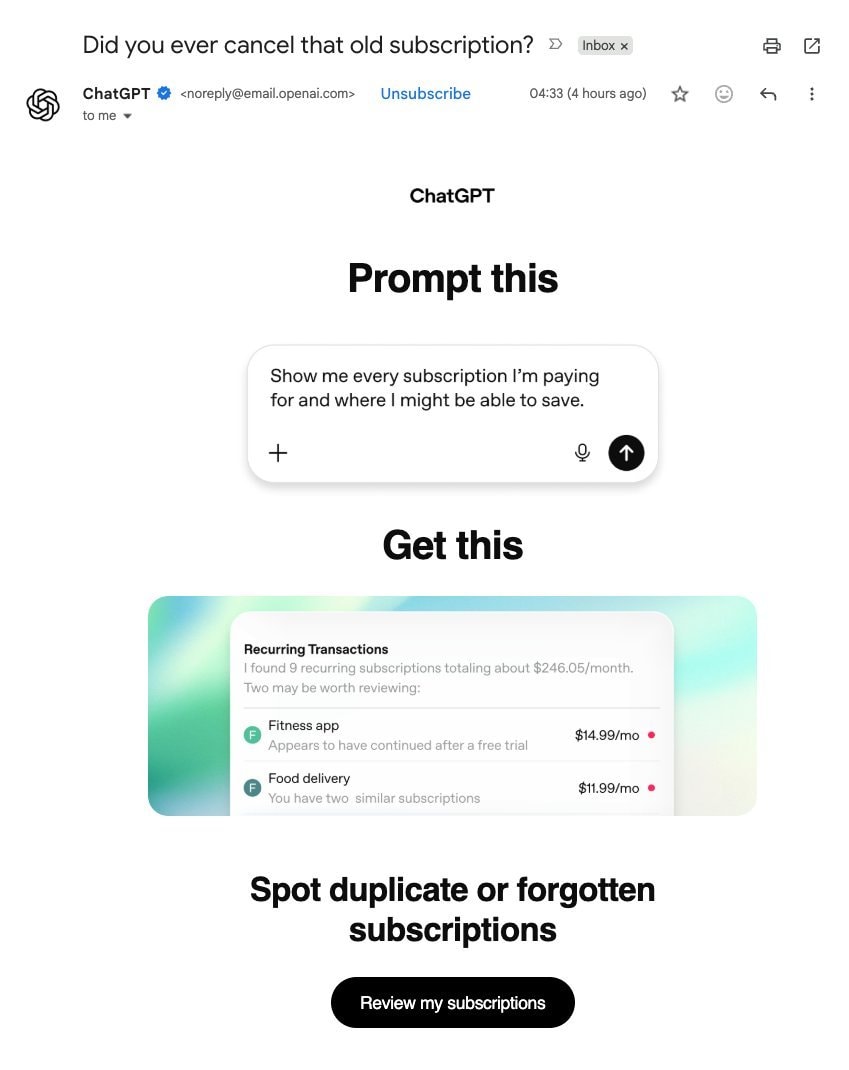
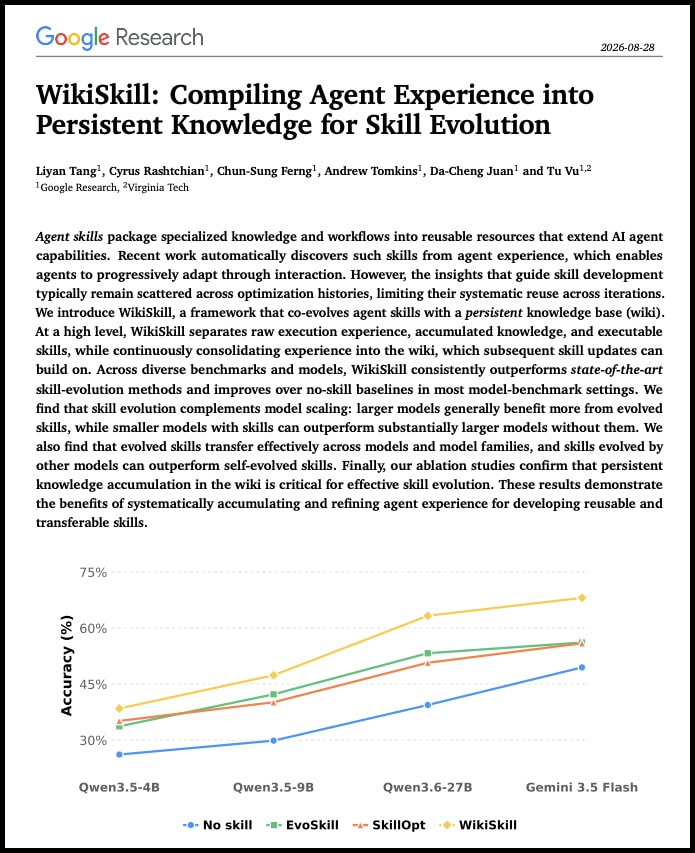
    Google WikiSkill paper SKILL.md agentsGoogle WikiSkill paper SKILL.md agentsone GOAT memeone GOAT memeaccurate memeaccurate memeJev 100x decision layer explainedJev 100x decision layer explainedLife of Developers infographicLife of Developers infographicSuperiorTrade Hyperliquid terminalSuperiorTrade Hyperliquid terminalChatGPT email screenshotChatGPT email screenshotHulk meme formatHulk meme formatVibe Coding vs Vibe Debugging memeVibe Coding vs Vibe Debugging memeAI accusation memeAI accusation memeGoogle Astra policy reactionGoogle Astra policy reactionJob portal tier list memeJob portal tier list mememuseum exhibit cartoonmuseum exhibit cartoonStanford CS329A Self-Improving AI AgentsStanford CS329A Self-Improving AI Agentsslavery to family memeslavery to family memePOLSIA founder story strategyPOLSIA founder story strategyJoe Rogan shocked reactionJoe Rogan shocked reactionCave Pro MaxCave Pro Max
    Photo
    Nate
    Nate@nate_5122w
    💭Tech💭AI🎮Visual Studio Code
    @Jolliai IDE dashboard

    @nate_512just dropped a privacy-first dashboard built specifically for agent workflows, and it plugs straight into your IDE instead of forcing context switches. Tracking AI spend usually means leaving your editor to check provider consoles, but Jolli reads local session history to generate analytics right where you code. The tool displays usage data in the native environment so you can access it via VS Code command palette or call it directly from Claude Code or Cursor without breaking flow. It automatically scans local session history and stores everything in a local SQLite database so your data stays on your machine unless syncing is explicitly enabled. I rarely get excited about analytics tools, but this actually keeps users focused by eliminating the need to jump between windows.

    Voir la publication d'origine

    @Jolliai IDE dashboard

    Photo de @nate_512· Sep 5, 2026· Tech

    À propos de cette photo

    The image is a screenshot of a dark-themed dashboard interface. The focus is on various statistics and metrics related to a system or application, presented in a clean, data-driven style. The dashboard displays sections for "Skills," "MCPs," "Tokens," "Spend," "Recall," and "Decisions," each with charts, graphs, and numerical data. Notable elements include bar charts showing usage and cost, stacked bar charts illustrating spending over time, and lists of recent activities or decisions. The overall mood is professional and analytical, typical of a software or project management tool. The top left corner shows the logo "Jolli" with "all repos" underneath.

    Voir toutes les photos de Tech

    ?

    Plus de photos de Tech

    Voir toutes les photos de Tech
    Google WikiSkill paper SKILL.md agentsGoogle WikiSkill paper SKILL.md agentsone GOAT memeone GOAT memeaccurate memeaccurate memeJev 100x decision layer explainedJev 100x decision layer explainedLife of Developers infographicLife of Developers infographicSuperiorTrade Hyperliquid terminalSuperiorTrade Hyperliquid terminalChatGPT email screenshotChatGPT email screenshotHulk meme formatHulk meme formatVibe Coding vs Vibe Debugging memeVibe Coding vs Vibe Debugging memeAI accusation memeAI accusation memeGoogle Astra policy reactionGoogle Astra policy reactionJob portal tier list memeJob portal tier list mememuseum exhibit cartoonmuseum exhibit cartoonStanford CS329A Self-Improving AI AgentsStanford CS329A Self-Improving AI Agentsslavery to family memeslavery to family memePOLSIA founder story strategyPOLSIA founder story strategyJoe Rogan shocked reactionJoe Rogan shocked reactionCave Pro MaxCave Pro Max