
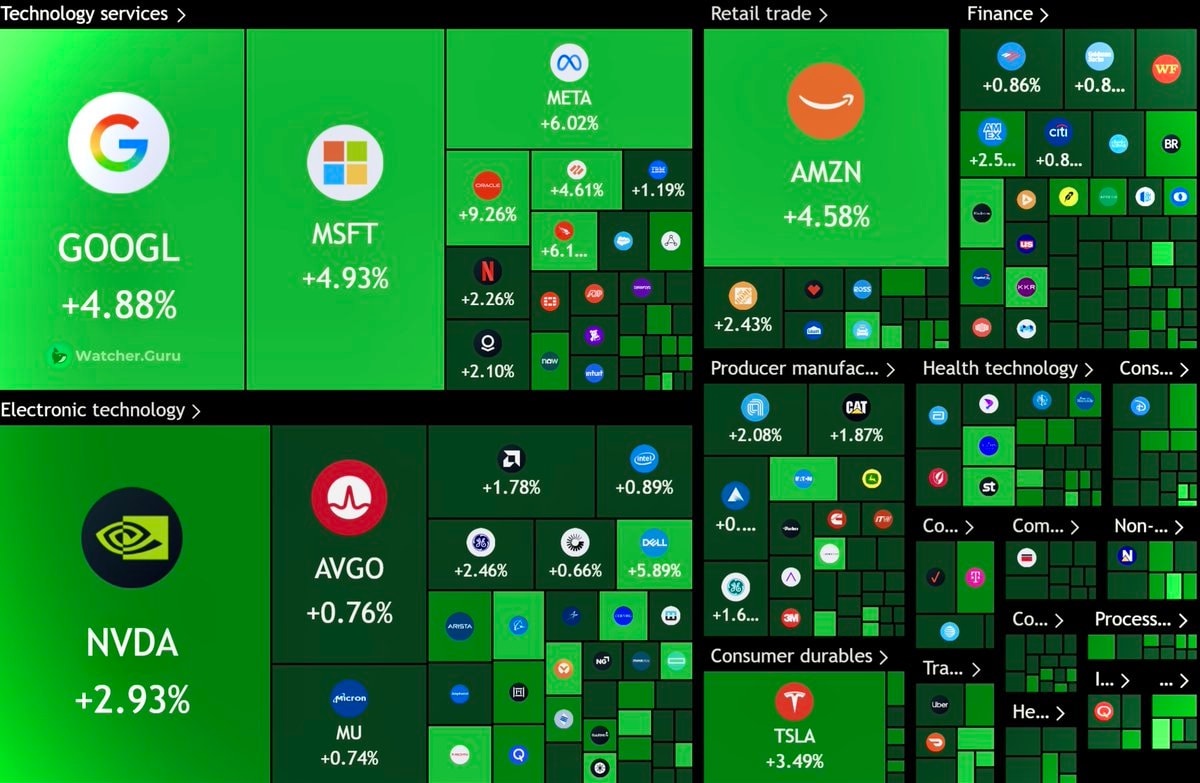
@Jakob.erasA trillion dollars of value just hit the US stock market in one session. The S&P 500 wrapped up at 7,600, with the big tech names all showing green on the heatmap
Voir la publication d'origine@Jakob.erasA trillion dollars of value just hit the US stock market in one session. The S&P 500 wrapped up at 7,600, with the big tech names all showing green on the heatmap
Voir la publication d'originePhoto de @Jakob.eras· Aug 3, 2026· Google
The image is a financial data visualization, likely a stock market heatmap. It displays various company logos and stock performance metrics across different industries. The overall mood is informative and data-driven, with a clean, grid-like aesthetic. Notable elements include the prominent logos of Google, Microsoft, Amazon, and Nvidia, along with their respective percentage gains. The green color scheme indicates positive stock performance. ON-SCREEN TEXT: Technology services > GOOGL +4.88% Watcher.Guru MSFT +4.93% Electronic technology > NVDA +2.93% META +6.02% +4.61% +1.19% +9.26% +2.26% +2.10% Retail trade > AMZN +4.58% +2.43% Producer manufac... > CAT +1.87% +2.08% AVGO +0.76% +1.78% +0.89% +2.46% +0.6
 2Wolves in Finland and Google data centers
 Trump Atlantic Ocean rename idea
 Donald Trump Atlantic Ocean rename
 2Trump Ocean rename claim
 2Larry Page moves family office
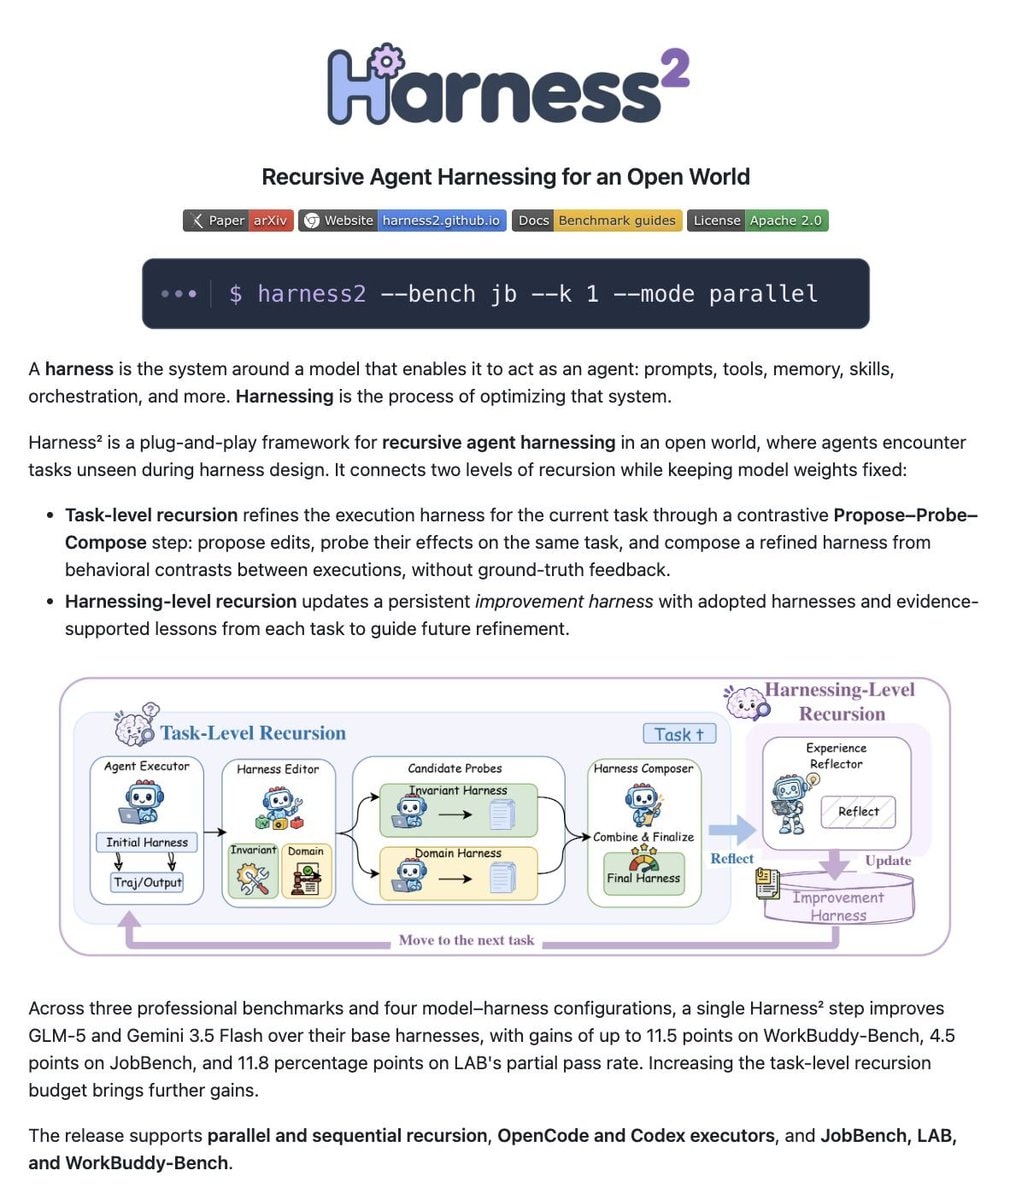 Harness² self-improving AI agents
 Anthropic Blackstone $60B financing deal
 Google logo for WNBA finals
 2Google quantum computing 99.99% accuracy test
 2Off Campus costumes trending for Halloween 2026
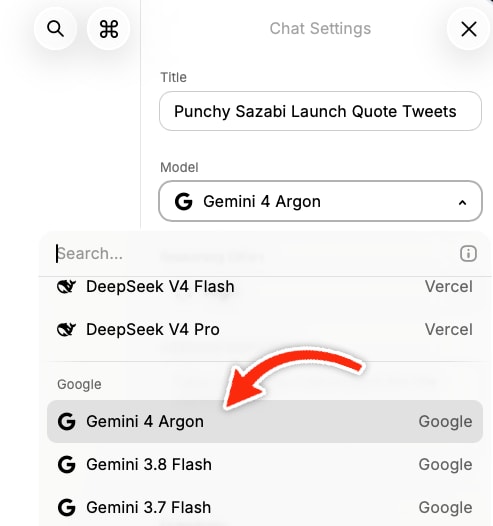 Gemini 4 Argon Raycast access
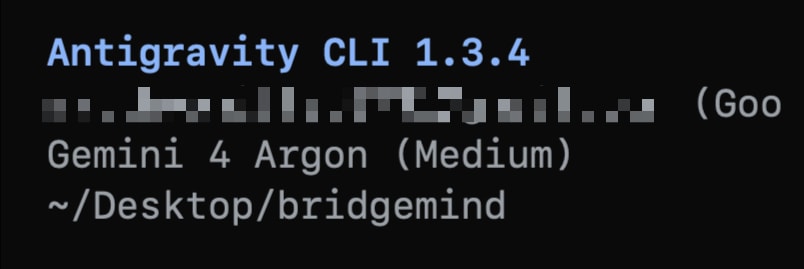 Gemini 4 Argon Antigravity CLI update
 2Google Gemini 4 Argon launch
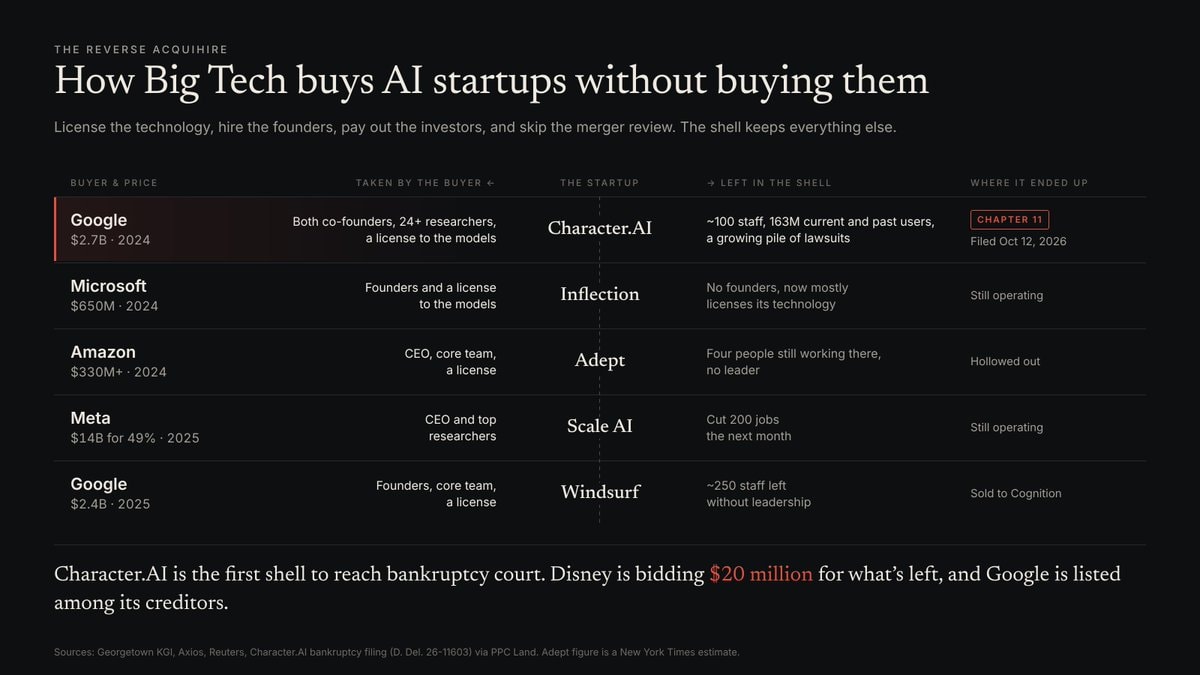 How Big Tech buys AI startups without buying them
 Google search joke
 Google 1998 vs today
 2Google Finland forest destruction
 Google TPU orbital launch
@Jakob.erasA trillion dollars of value just hit the US stock market in one session. The S&P 500 wrapped up at 7,600, with the big tech names all showing green on the heatmap
Voir la publication d'originePhoto de @Jakob.eras· Aug 3, 2026· Google
The image is a financial data visualization, likely a stock market heatmap. It displays various company logos and stock performance metrics across different industries. The overall mood is informative and data-driven, with a clean, grid-like aesthetic. Notable elements include the prominent logos of Google, Microsoft, Amazon, and Nvidia, along with their respective percentage gains. The green color scheme indicates positive stock performance. ON-SCREEN TEXT: Technology services > GOOGL +4.88% Watcher.Guru MSFT +4.93% Electronic technology > NVDA +2.93% META +6.02% +4.61% +1.19% +9.26% +2.26% +2.10% Retail trade > AMZN +4.58% +2.43% Producer manufac... > CAT +1.87% +2.08% AVGO +0.76% +1.78% +0.89% +2.46% +0.6
2Wolves in Finland and Google data centersTrump Atlantic Ocean rename ideaDonald Trump Atlantic Ocean rename2Trump Ocean rename claim2Larry Page moves family officeHarness² self-improving AI agentsAnthropic Blackstone $60B financing dealGoogle logo for WNBA finals2Google quantum computing 99.99% accuracy test2Off Campus costumes trending for Halloween 2026Gemini 4 Argon Raycast accessGemini 4 Argon Antigravity CLI update2Google Gemini 4 Argon launchHow Big Tech buys AI startups without buying themGoogle search jokeGoogle 1998 vs today2Google Finland forest destructionGoogle TPU orbital launch